1.6. Zoom Level#
Leaflet uses latitude, longitude, and “zoom level.”
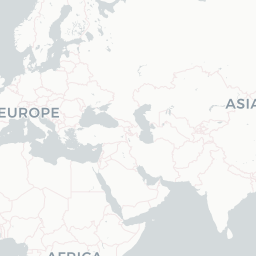
A lower zoom level means that the map shows the entire continent, while a higher zoom level means that the map can display the details of the city.
In order to understand how the zoom level works, we first need to make a basic introduction to geodesy.
1.6.1. Shape of the earth#
Let’s look at a simple map that is locked at level 0:
var map = L.map('map', {
    minZoom: 0,
    maxZoom: 0
});

var positron = L.tileLayer('http://{s}.basemaps.cartocdn.com/light_all/{z}/{x}/{y}.png', {
attribution: cartodbAttribution
}).addTo(map);

map.setView([0, 0], 0);
| Show the example |
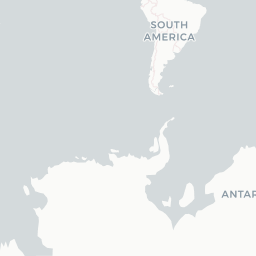
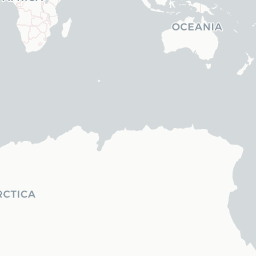
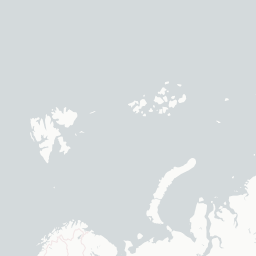
Please note that the “whole earth” is just a 256-pixel wide, 256-pixel image:
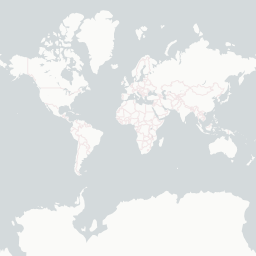
Be clear: the earth is not a square. More precisely, the shape of the earth is like a strange potato, which can be approximated as something similar to a sphere.

So we assume that the earth is round. To make it flat, we put an imaginary cylinder around it, unfold it, and then cut it to make it look square:
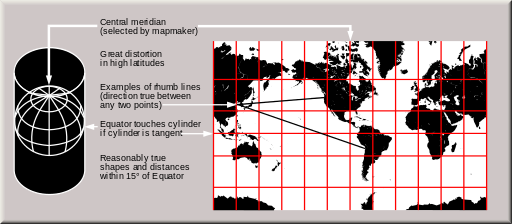
There are hundreds of ways to display the Earth’s surface in a plane, each with its advantages and disadvantages, which is just one of them.
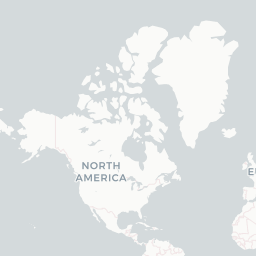
Now let’s assume the world is a square:
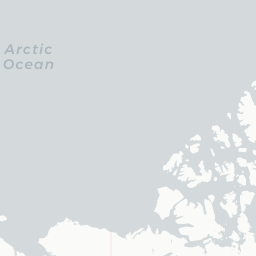
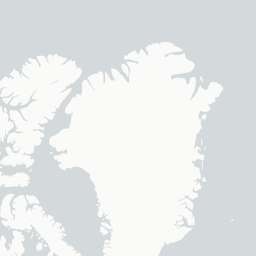
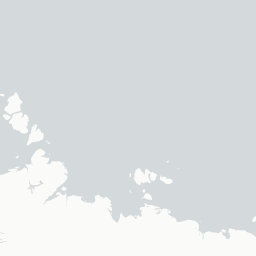
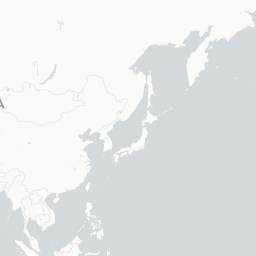
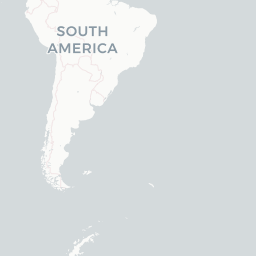
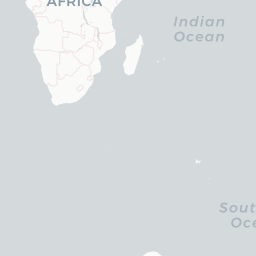
When the zoom level is 0, it represents the world, and its width and height are both 256 pixels. When we move to the next zoom level, its width and height are doubled and can be represented by four 256-pixel by 256-pixel images:
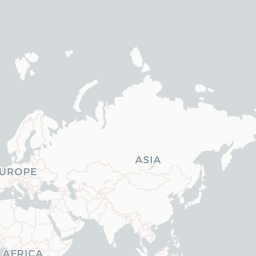
At each zoom level, each tile is divided into four, the size (the length
of the edge given by the tileSize option) doubles, and the area is
increased by a factor of three.
|
|
|
|
| Zoom 0 | Zoom 1 | Zoom 2 |
1.6.2. Notes on proportions#
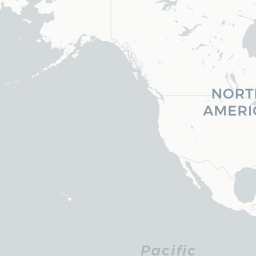
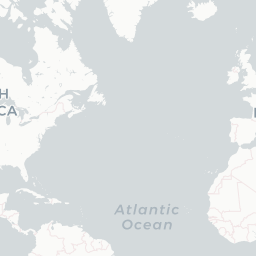
One of the disadvantages of using a cylindrical projection is that the scale is not constant and the measurement distance or size is not reliable, especially at low zoom levels.
Translate the equator to 60° north latitude by adding a
L.Control.Scale to the map. We can see how the scale factor is
doubled. The following example uses a JavaScript timeout to automate:
L.control.scale().addTo(map);

setInterval(function(){
    map.setView([0, 0]);
    setTimeout(function(){
        map.setView([60, 0]);
    }, 2000);
}, 4000);
| Show the example |
L.Control.Scale displays the scales that apply to the center point
of the map. At relatively high zoom levels, the scale changes are not
obvious.
1.6.3. Control zoom#
A leaflet map has several ways to control the zoom level it displays,
but the most notable is setZoom(). For example, map.setZoom(0) sets
the zoom level of map to 0.
This example again uses the timeout to automatically alternate between zoom levels 0 and 1:
setInterval(function(){
    map.setZoom(0);
    setTimeout(function(){
        map.setZoom(1);
    }, 2000);
}, 4000);
| Show the example |
Other ways to set the zoom:
setView(center, zoom), It also sets the center of the mapflyTo(center, zoom), Similar tosetView, but it has smooth animationszoomIn()/zoomIn(delta), Zoom in to thedeltazoom level with a default zoom level of1zoomOut()/zoomOut(delta), Reduce thedeltazoom level with a default zoom level of1setZoomAround(fixedPoint, zoom), Set thedeltalevel while maintaining a fixed point (scroll mouse wheel zoom)fitBounds(bounds),Automatically calculate scaling to match rectangular areas on the map
1.6.4. Fractional scaling#
Fractional scaling is a new concept proposed in Leaflet 1.0.0. Prior to this, the map’s zoom level can only be an integer (0, 1, 2, etc.), but scores like 1.5 or 1.25 can now be used.
Fractional scaling is disabled by default. To enable it, use the MAP’s
zoomSnap option. The default value for the zoomSnap option is 1
(which means the zoom level of the map can be 0, 1, 2, etc.).
If you set the value of zoomSnap to 0.5, the effective zoom
level for the map will be 1, 1.5, 2, etc.
If the setting is 0.1, the effective zoom level for the map will be
0, 0.1, 0.2, 0.3, 0.4, etc.
The following example uses the zoomSnap value as 0.25:
var map = L.map('map', {
    zoomSnap: 0.25
});
| Show the example |
As you can see, Leaflet only loads tiles with a zoom level of 0 or
1 and Need to scale them.
The Leaflet will zoom to the most recent one. For example, if you have
zoomSnap: 0.25, you try to do map.setZoom(0.8) and the zoom will
return To 0.75.
There is another important map option related to zoomSnap:
zoomDelta option. It controls the zoom level of the image when using
the zoom button (from the default L.Control.Zoom) or the +/- keys on
the keyboard.
For scrolling mouse wheel zoom, the wheelPxPerZoomLevel option
controls the zoom speed of the mouse wheel.
Here’s an example where zoomSnap is set to zero:
var map = L.map('map', {
    zoomDelta: 0.25,
    zoomSnap: 0
});
Try the following to see how the zoom level changes:
If you have a touch screen, please pinch the zoom
Zoom with the mouse wheel
Make a box zoom (hold the
shiftkey on the keyboard while dragging the mouse)Use the zoom button
| View the instance |
This tutorial is over. Now show your zoom level on the map!